U.S. Public School Districts That Spend the Most and Least per Student
“If you think education is expensive, try ignorance.” ~ Derek Bok, former President of Harvard University
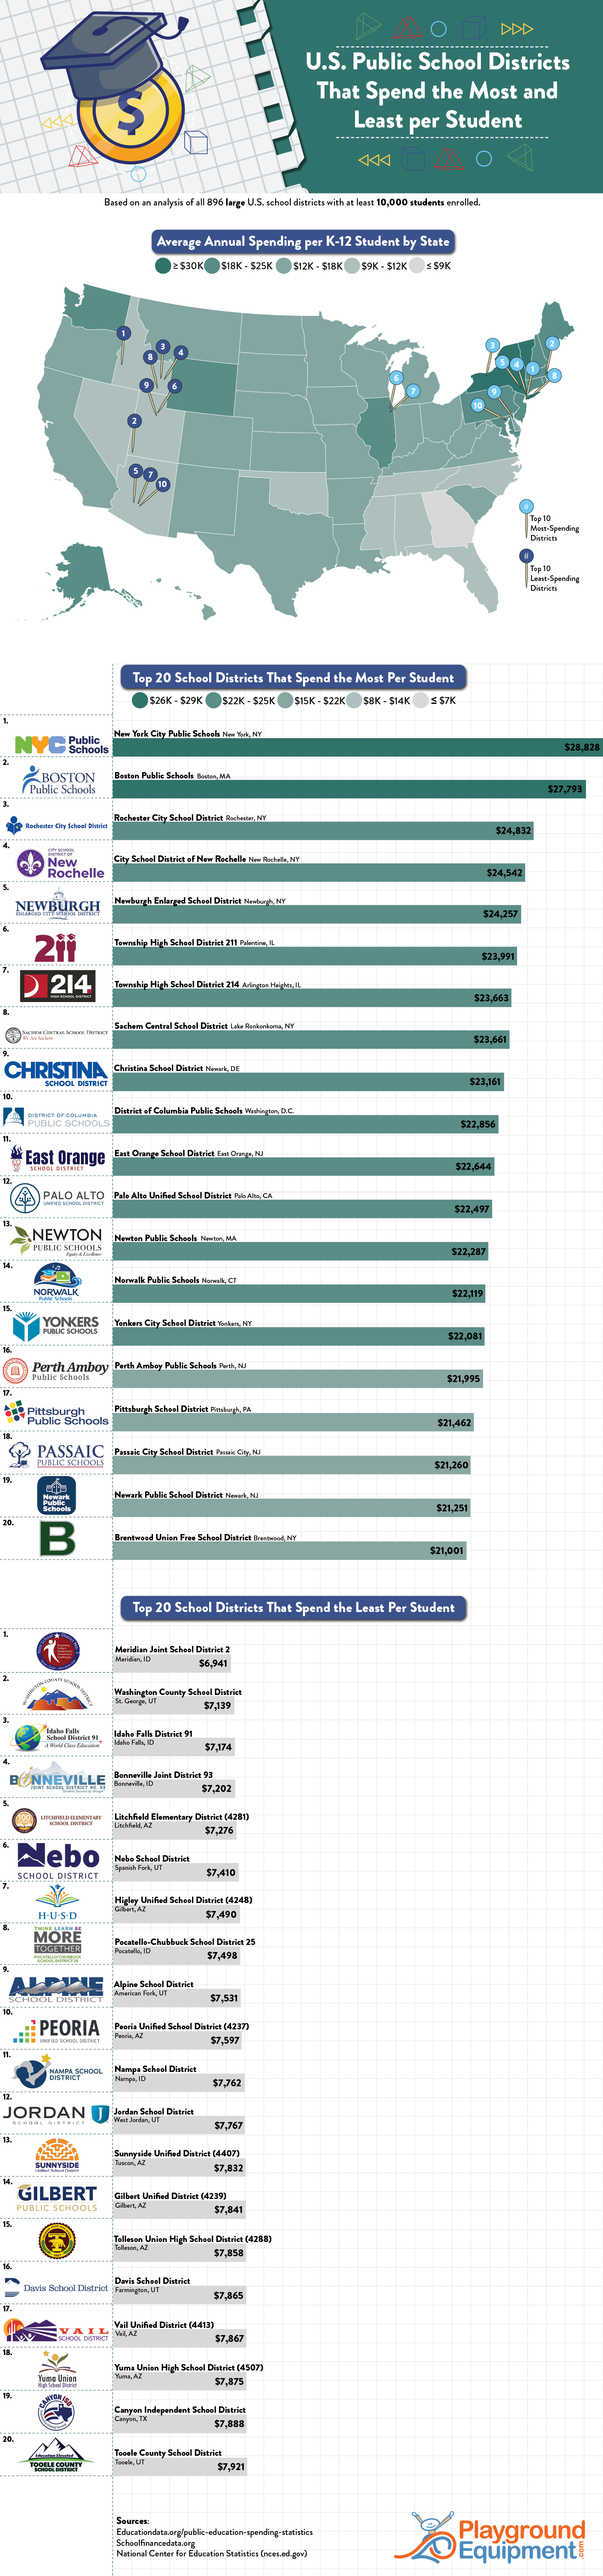
Public education is a vital cornerstone to the success and progress of nations across the globe. Part of why we pay taxes is to provide the funding that makes public education possible. How much does public education cost per student in the United States? According to the U.S. Census Bureau, public school spending per student reached $14,347 in 2021, making it the largest fiscal year-over-year increase since 2008. Since public school spending per pupil varies dramatically by state and by district, the team at Playground Equipment has delved into public school spending data to create this visualization revealing the school districts that spend the most and least per student across the country:
Click to view the full-size infographic:
Embed this image on your site:
Which School District Spends The Most per Student?
Which school district spends the most per pupil? The School Finance Indicators Database reports that New York City Public Schools spends the most per student each year at $28,828. Let’s learn a bit more about this expansive and incredibly important school district. New York City Public Schools encompasses 1819 schools and serves nearly one million students! There are 709 preschools, 1,064 elementary schools, 710 middle schools, and 571 high schools. 90% of the students are minorities and 55.7% are economically disadvantaged. The student teacher ratio is 3,608:1, which is staggering compared to the state average of 13:1. The high school graduation rate of New York City Public Schools is 79.5%, which is on par with the national average. So why does NYC spend so much on education? The immense body of students that it serves, many of which are in need of financial assistance, is a major factor in New York City’s public education costs. New York City Public Schools has provided a comprehensive breakdown of its $37.5 billion dollar budget for 2023-2024, which truly highlights just how colossal the school district is. Here are some standouts from the data:
- $7.3 billion goes to employee benefits and pension
- $3.2 billion goes to debt payments
- $2.2 billion goes to Early Childhood Birth-to-Five services
- $4.3 billion goes to school operations
- $15.1 billion goes to K-12 schools and instruction
- 800,000 meals are served daily with free breakfast and lunch available to all students
- 150,000 students are transported across roughly 9,000 bus routes
- Over 100 million square feet of space is cleaned, maintained, and receiving utilities
- 4,000 safety agents, 7,700 food workers, 8,500 bus drivers, 7,200 bus attendants, 860 custodian engineers, and 5,700 cleaners and handypersons are on the payroll
These figures help to put into perspective why New York City Public Schools spends so much per student. With so many employees to pay, so much space to maintain, and so many students to teach, transport, and feed, the expenses add up.
Which State Spends The Most On Education?
The national average education spending by state is $14,347 per pupil, although some states spend significantly more (and significantly less). Generally speaking, northeast states spend the most on education per student. Which state spends the most per student for public K-12 education? According to the Education Data Initiative, New York spends an average of $30,282 per student annually, making it the state that spends the most on education. Here are the top five states that spend the most on public education per pupil:
- New York - $30,282
- Vermont - $24,666
- New Jersey - $23,870
- Connecticut - $23,455
- Massachusetts - $22,913
Why does New York Spend so much on education per student? According to the Empire Center for Public Policy, New York’s high education expenditures are primarily driven by instructional salaries and benefits. This expense equates to around $18,402 per pupil, which is 111 percent above the national average of $8,728. Another factor that influences New York’s hefty education spending are “support services”, which measures bureaucratic overhead such as administrative services. This expense ranks 6th in the nation at $7,713 per pupil, 49 percent above the national average. However, New York would still rank first even if this expense was aligned with the national average, disputing any claims that New York’s high education spending is simply due to administrative costs. If you want to learn more about education spending in New York, check out this interactive map that showcases New York’s school budgeting by district, average spending by county, change in spending by district, and average spending by region.
Where Does Education Spending Come From?
These are enormous amounts of money, so you may be wondering: where does public education funding come from? For fiscal year 2021, 45% of funding for K-12 education came from state governments, 44% from local governments, and 11% from the federal government. States primarily earn their money through income, sales, and property taxes, as well as grants from the federal government. How much of our taxes go to education? The proportion of tax revenue that is allocated to public education varies significantly by state. Here are some fascinating education spending statistics that shine some light on how our tax money is used in education:
- Nationally, expenditures are equivalent to about 3.57% of taxpayer income.
- The federal government spends 4% of its budget on education. It spends about 13% on defense.
- The United States does not fulfill UNESCO’s benchmark of a 15.00% share of total public expenditure on education.
- The United States’ GDP (gross domestic product) has been growing 13.5% faster than public education budgets.
As we’ve previously discussed, various education-related expenses, such as playground structures, can be partially or completely covered by grants. With state or national grant funding, the most amazing school playgrounds and commercial swing sets can become a reality for your school. Find out more in our exhaustive guide to playground grants.
Fair Use
Please feel free to share and publish this infographic as you please, we just ask that you credit us by linking to this original page.
Methodology
We created this infographic using data from the Education Data Initiative’s U.S. Public Education Spending Statistics, The School Finance Indicators Database,The United States Census Bureau, and the National Center for Education Statistics.
U.S. School Districts That Spend the Most and Least Per Student Annually
Top 25 School Districts That Spend the Most Per Pupil
|
Rank |
District |
Spending Per Pupil |
District Enrollment |
Main Location |
|
1 |
New York City Public Schools |
$28,828 |
956,634 |
New York, New York |
|
2 |
Boston School District |
$27,793 |
50,480 |
Boston, MA |
|
3 |
Rochester City School District |
$24,832 |
26,924 |
Rochester, NY |
|
4 |
New Rochelle City School District |
$24,542 |
10,553 |
New Rochelle, NY |
|
5 |
Newburgh City School District |
$24,257 |
11,619 |
Newburgh, NY |
|
6 |
Township High School District 211 |
$23,991 |
11,855 |
Palentine, IL |
|
7 |
Township High School District 214 |
$23,663 |
11,774 |
Arlington Heights, IL |
|
8 |
Sachem Central School District |
$23,661 |
12,484 |
Lake Ronkonkoma, NY |
|
9 |
Christina School District |
$23,161 |
13,370 |
Newark, Delaware |
|
10 |
District Of Columbia Public Schools |
$22,856 |
50,971 |
Washington, D.C. |
|
11 |
East Orange School District |
$22,644 |
10,094 |
East Orange, NJ |
|
12 |
Palo Alto Unified School District |
$22,497 |
11,745 |
Palo Alto, CA |
|
13 |
Newton Public Schools |
$22,287 |
12,779 |
Newton, MA |
|
14 |
Norwalk Public Schools |
$22,119 |
11,642 |
Norwalk, CT |
|
15 |
Yonkers City School District |
$22,081 |
26,331 |
Yonkers, NY |
|
16 |
Perth Amboy Public School District |
$21,995 |
11,212 |
Perth, NJ |
|
17 |
Pittsburgh School District |
$21,462 |
22,665 |
Pittsburgh, PA |
|
18 |
Passaic City School District |
$21,260 |
14,358 |
Passaic City, NJ |
|
19 |
Newark Public School District |
$21,251 |
41,629 |
Newark, NJ |
|
20 |
Brentwood Union Free School District |
$21,001 |
19,283 |
Brentwood, NY |
|
21 |
Syracuse City School District |
$20,989 |
20,234 |
Syracuse, NY |
|
22 |
Stamford School District |
$20,957 |
16,479 |
Stamford, CT |
|
23 |
Wappingers Central School District |
$20,940 |
10,836 |
Wappingers, NY |
|
24 |
Hartford School District |
$20,796 |
18,081 |
Hartford, CT |
|
25 |
Jersey City Public Schools |
$20,722 |
29,113 |
Jersey City, NJ |
Top 25 School Districts That Spend the Least Per Pupil
|
Rank |
District |
Spending Per Pupil |
District Enrollment |
Main Location |
|
1 |
Meridian Joint School District 2 |
$6,941 |
40,600 |
Meridian, ID |
|
2 |
Washington County School District |
$7,139 |
35,920 |
St. George, UT |
|
3 |
Idaho Falls District |
$7,174 |
10,286 |
Idaho Falls, ID |
|
4 |
Bonneville Joint District |
$7,202 |
13,382 |
Bonneville, ID |
|
5 |
Litchfield Elementary District (4281) |
$7,276 |
11,859 |
Litchfield, AZ |
|
6 |
Nebo School District |
$7,410 |
34,171 |
Spanish Fork, UT |
|
7 |
Higley Unified School District (4248) |
$7,490 |
13,050 |
Gilbert, AZ |
|
8 |
Pocatello-Chubbuck School District |
$7,498 |
12,502 |
Pocatello, ID |
|
9 |
Alpine School District |
$7,531 |
83,540 |
American Fork, UT |
|
10 |
Peoria Unified School District (4237) |
$7,597 |
37,842 |
Peoria, AZ |
|
11 |
Nampa School District |
$7,762 |
15,699 |
Nampa, ID |
|
12 |
Jordan School District |
$7,767 |
57,771 |
West Jordan, UT |
|
13 |
Sunnyside Unified District (4407) |
$7,832 |
15,610 |
Tuscon, AZ |
|
14 |
Gilbert Unified District (4239) |
$7,841 |
34,651 |
Gilbert, AZ |
|
15 |
Tolleson Union High School District (4288) |
$7,858 |
12,496 |
Tolleson, AZ |
|
16 |
Davis School District |
$7,865 |
74,773 |
Farmington, UT |
|
17 |
Vail Unified District (4413) |
$7,867 |
13,792 |
Vail, AZ |
|
18 |
Yuma Union High School District (4507) |
$7,875 |
11,303 |
Yuma, AZ |
|
19 |
Canyon Independent School District |
$7,888 |
10,381 |
Canyon, TX |
|
20 |
Tooele County School District |
$7,921 |
17,913 |
Tooele, UT |
|
21 |
Leander Independent School District |
$7,924 |
41,381 |
Leander, TX |
|
22 |
Weber School District |
$7,954 |
32,910 |
Ogden, UT |
|
23 |
Broken Arrow Public Schools |
$7,963 |
19,436 |
Broken Arrow, OK |
|
24 |
Forney Independent School District |
$7,990 |
11,977 |
Forney, TX |
|
25 |
Cache County School District |
$8,078 |
19,260 |
North Logan, UT |
Learn about the author: Ben Thompson