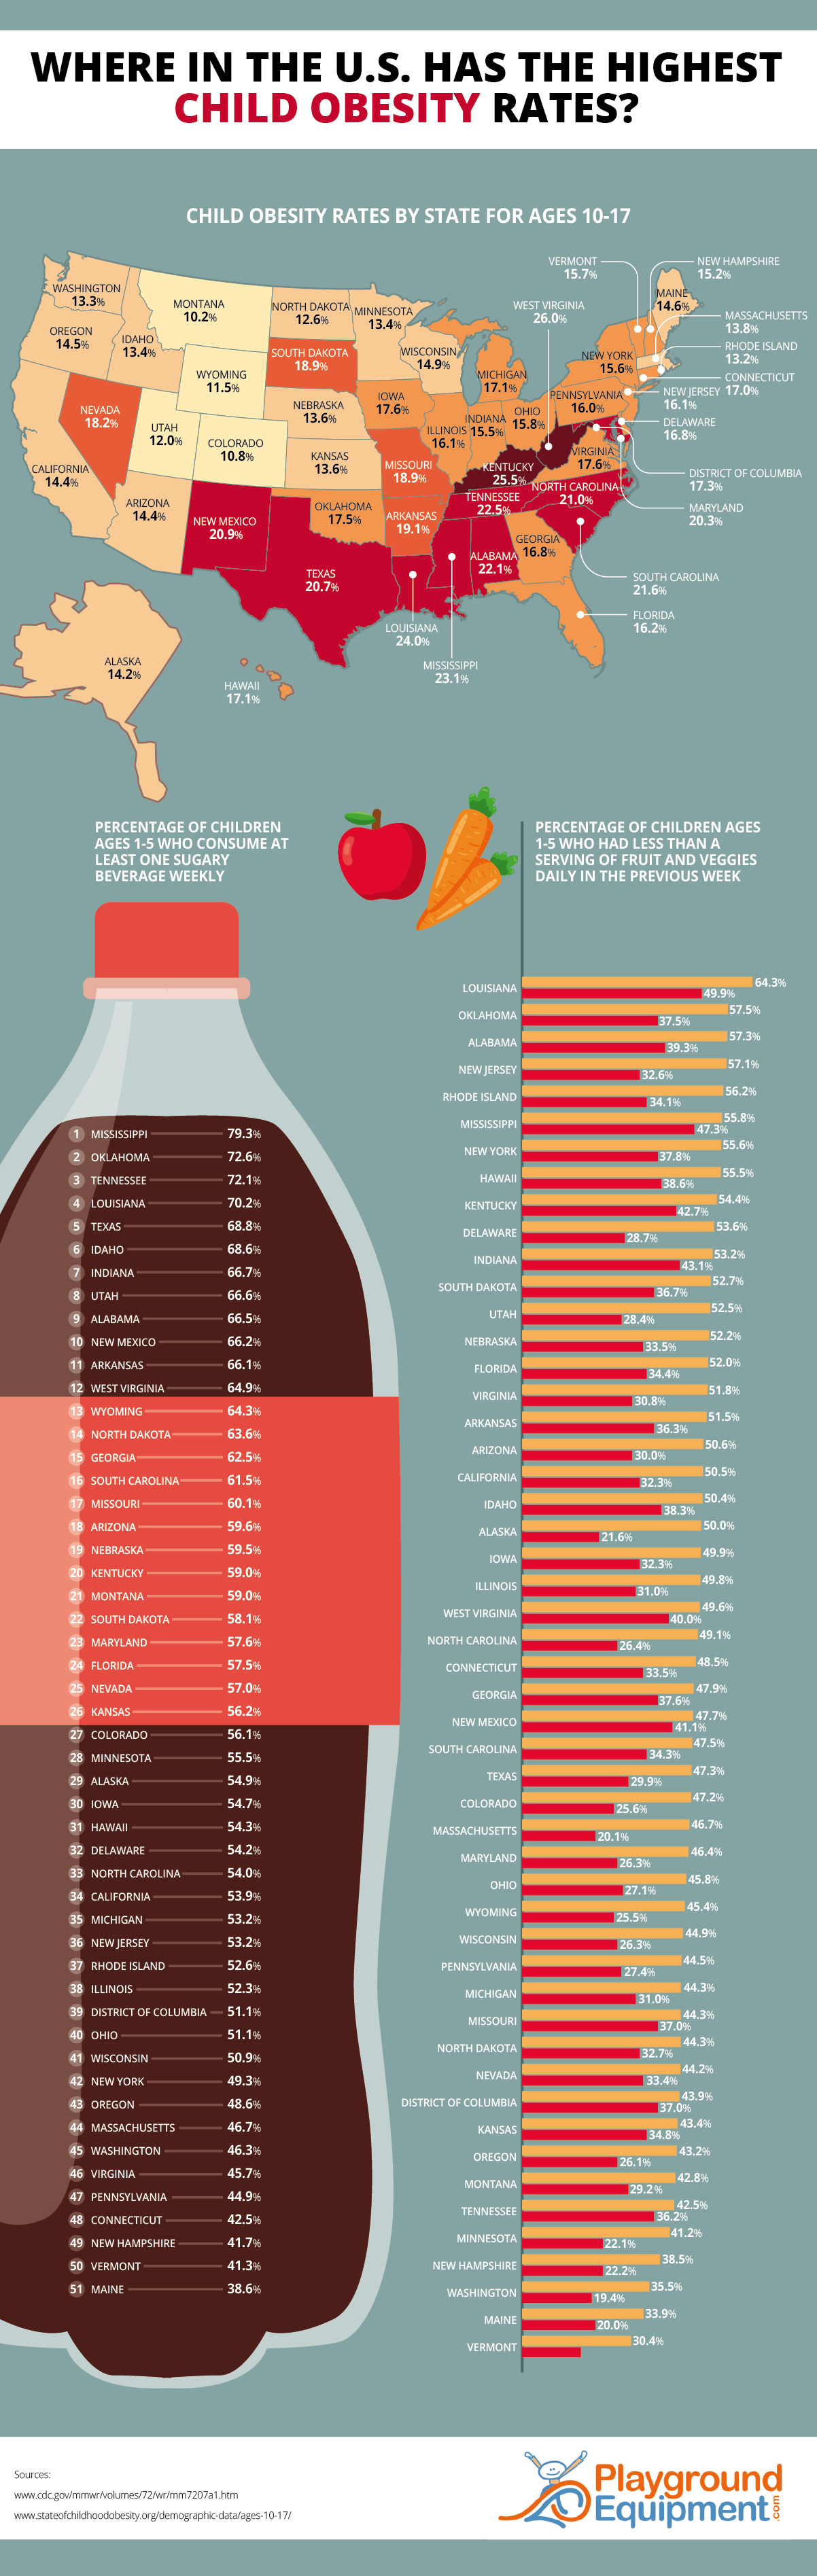
Where in the U.S. Has the Highest Childhood Obesity Rates?
Child obesity in the United States is a serious problem that has been escalating over the years. In fact, it has been called “one of the most serious public health challenges of the 21st century” by the Harvard T.H. Chan School of Public Health. The child obesity rate in America is about 1 in 5, which equals around 14.7 million children and adolescents. If you factor in overweight children who have not reached obese levels, the situation gets even more dire: Nearly 1 in 3 children in the United States is overweight or obese.
According to the Global Obesity Observatory, the child obesity rate in the United States is the 12th highest in the world. But the first step toward being proactive and making changes is awareness. That’s why Playground Equipment created this infographic examining child obesity rates by state:
Click to view the full-size infographic:
Embed this image on your site:
Which U.S. State Has the Highest Child Obesity Rate?
Here are the 15 states with the highest child obesity rates:
- West Virginia: 26%
- Kentucky: 25.5%
- Louisiana: 24%
- Mississippi: 23.1%
- Tennessee: 22.5%
- Alabama: 22.1%
- South Carolina: 21.6%
- North Carolina: 21.0%
- New Mexico: 20.9%
- Texas: 20.7%
- Maryland: 20.3%
- Arkansas: 19.1%
- Missouri: 18.9%
- South Dakota: 18.9%
- Nevada: 18.2%
Which U.S. State Has the Lowest Child Obesity Rate?
Here are the 15 states with the lowest child obesity rates:
- Montana: 10.2%
- Colorado: 10.8%
- Wyoming: 11.5%
- Utah: 12.0%
- North Dakota: 12.6%
- Rhode Island: 13.2%
- Washington: 13.3%
- Minnesota: 13.4%
- Idaho: 13.4%
- Nebraska: 13.6%
- Kansas: 13.6%
- Massachusetts: 13.8%
- Alaska: 14.2%
- California: 14.4%
- Arizona: 14.4%
Beyond the child obesity rates by state, we also compiled data on sugar-sweetened beverage consumption by state as well as fruit and vegetable consumption rates. These factors contribute to the overall child obesity crisis. The correlation between sugar-sweetened beverages and child obesity is heavily supported by multiple studies.
Why Is Child Obesity Dangerous?
The side effects of child obesity can be significant. In fact, the consequences of child obesity can extend into adulthood and cause lifelong physical and mental health challenges. Child obesity dangers can include type 2 diabetes, high blood pressure, high cholesterol, liver disease, bone and joint problems, respiratory issues such as asthma, sleep disorders including difficulty breathing while asleep (sleep apnea), abnormally early puberty or menstruation, eating disorders, skin infections, and fatigue. Child obesity consequences go beyond just the physical, too. The psychological side effects of child obesity can include susceptibility to being bullied or bullying others, poor self-esteem, social isolation, increased risk of depression, and anxiety.
Today’s children are being diagnosed more often with health conditions that had been almost exclusively found in adults. Some experts believe we may be approaching the first generation of children with a shorter life expectancy than their parents due to obesity-related diseases.
Do Obese Children Turn Into Obese Adults?
Unfortunately, an extensive meta-analysis including 15 studies and 200,777 participants found that obese children and adolescents are around five times more likely to be obese as adults than those who were not obese as children. Around 55% of obese children go on to be obese as adolescents, around 80% of obese adolescents remain obese in adulthood, and around 70% will be obese beyond age 30. Therefore, it’s important to take action to help reduce these trends and empower children to live healthy, happy lives in the present and into adulthood.
Here are some resources to help fight child obesity at home and beyond:
- Preventing Childhood Obesity: Four Things Families Can Do — Centers for Disease Control and Prevention
- Tips to Help Children Maintain a Healthy Weight — Centers for Disease Control and Prevention
- Helping Your Child Who Is Overweight — National Institute of Diabetes and Digestive and Kidney Diseases
- Weight Loss Strategies for Overweight Kids — Grow by WebMD
- How to Combat Childhood Obesity: A Detailed Guide for Parents, Children, and Health Practitioners — National Association of County and City Health Officials
Playtime and recess have also been found to help children maintain a healthy weight. The CDC recommends that children should enjoy at least 60 minutes of physical activity daily. Both sports and unstructured play can help children stay fit and develop habits that can lead them through healthy, active adult lives. The benefits of play are plentiful, and natural weight management while having fun is a win-win!
Where in the U.S. Has the Highest Child Obesity Rates?
|
1 |
West Virginia |
26.0% |
|
2 |
Kentucky |
25.5% |
|
3 |
Louisiana |
24.0% |
|
4 |
Mississippi |
23.1% |
|
5 |
Tennessee |
22.5% |
|
6 |
Alabama |
22.1% |
|
7 |
South Carolina |
21.6% |
|
8 |
North Carolina |
21.0% |
|
9 |
New Mexico |
20.9% |
|
10 |
Texas |
20.7% |
|
11 |
Maryland |
20.3% |
|
12 |
Arkansas |
19.1% |
|
14 |
Missouri |
18.9% |
|
14 |
South Dakota |
18.9% |
|
15 |
Nevada |
18.2% |
|
17 |
Iowa |
17.6% |
|
17 |
Virginia |
17.6% |
|
18 |
Oklahoma |
17.5% |
|
19 |
District of Columbia |
17.3% |
|
21 |
Hawaii |
17.1% |
|
21 |
Michigan |
17.1% |
|
22 |
Connecticut |
17.0% |
|
24 |
Delaware |
16.8% |
|
24 |
Georgia |
16.8% |
|
25 |
Florida |
16.2% |
|
27 |
Illinois |
16.1% |
|
27 |
New Jersey |
16.1% |
|
28 |
Pennsylvania |
16.0% |
|
29 |
Ohio |
15.8% |
|
30 |
Vermont |
15.7% |
|
31 |
New York |
15.6% |
|
32 |
Indiana |
15.5% |
|
33 |
New Hampshire |
15.2% |
|
34 |
Wisconsin |
14.9% |
|
35 |
Maine |
14.6% |
|
36 |
Oregon |
14.5% |
|
38 |
Arizona |
14.4% |
|
38 |
California |
14.4% |
|
39 |
Alaska |
14.2% |
|
40 |
Massachusetts |
13.8% |
|
42 |
Kansas |
13.6% |
|
42 |
Nebraska |
13.6% |
|
44 |
Idaho |
13.4% |
|
44 |
Minnesota |
13.4% |
|
45 |
Washington |
13.3% |
|
46 |
Rhode Island |
13.2% |
|
47 |
North Dakota |
12.6% |
|
48 |
Utah |
12.0% |
|
49 |
Wyoming |
11.5% |
|
50 |
Colorado |
10.8% |
|
51 |
Montana |
10.2% |
Consumption of Fruits, Vegetables, and Sugary Drinks by State
|
State |
|||
|
Fruit |
Vegetables |
Sugar-Sweetened Beverages |
|
|
Percent Who Consumed Less Than One Serving Daily |
Percent Who Consumed at Least Once Weekly |
||
|
Alabama |
39.3 |
57.3 |
66.5 |
|
Alaska |
21.6 |
50.0 |
54.9 |
|
Arizona |
30.0 |
50.6 |
59.6 |
|
Arkansas |
36.3 |
51.5 |
66.1 |
|
California |
32.3 |
50.5 |
53.9 |
|
Colorado |
25.6 |
47.2 |
56.1 |
|
Connecticut |
33.5 |
48.5 |
42.5 |
|
Delaware |
28.7 |
53.6 |
54.2 |
|
District of Columbia |
37.0 |
43.9 |
51.1 |
|
Florida |
34.4 |
52.0 |
57.5 |
|
Georgia |
37.6 |
47.9 |
62.5 |
|
Hawaii |
38.6 |
55.5 |
54.3 |
|
Idaho |
38.3 |
50.4 |
68.6 |
|
Illinois |
31.0 |
49.8 |
52.3 |
|
Indiana |
43.1 |
53.2 |
66.7 |
|
Iowa |
32.3 |
49.9 |
54.7 |
|
Kansas |
34.8 |
43.4 |
56.2 |
|
Kentucky |
42.7 |
54.4 |
59.0 |
|
Louisiana |
49.9 |
64.3 |
70.2 |
|
Maine |
20.0 |
33.9 |
38.6 |
|
Maryland |
26.3 |
46.4 |
57.6 |
|
Massachusetts |
20.1 |
46.7 |
46.7 |
|
Michigan |
31.0 |
44.3 |
53.2 |
|
Minnesota |
22.1 |
41.2 |
55.5 |
|
Mississippi |
47.3 |
55.8 |
79.3 |
|
Missouri |
37.0 |
44.3 |
60.1 |
|
Montana |
29.2 |
42.8 |
59.0 |
|
Nebraska |
33.5 |
52.2 |
59.5 |
|
Nevada |
33.4 |
44.2 |
57.0 |
|
New Hampshire |
22.2 |
38.5 |
41.7 |
|
New Jersey |
32.6 |
57.1 |
53.2 |
|
New Mexico |
41.1 |
47.7 |
66.2 |
|
New York |
37.8 |
55.6 |
49.3 |
|
North Carolina |
26.4 |
49.1 |
54.0 |
|
North Dakota |
32.7 |
44.3 |
63.6 |
|
Ohio |
27.1 |
45.8 |
51.1 |
|
Oklahoma |
37.5 |
57.5 |
72.6 |
|
Oregon |
26.1 |
43.2 |
48.6 |
|
Pennsylvania |
27.4 |
44.5 |
44.9 |
|
Rhode Island |
34.1 |
56.2 |
52.6 |
|
South Carolina |
34.3 |
47.5 |
61.5 |
|
South Dakota |
36.7 |
52.7 |
58.1 |
|
Tennessee |
36.2 |
42.5 |
72.1 |
|
Texas |
29.9 |
47.3 |
68.8 |
|
Utah |
28.4 |
52.5 |
66.6 |
|
Vermont |
16.3 |
30.4 |
41.3 |
|
Virginia |
30.8 |
51.8 |
45.7 |
|
Washington |
19.4 |
35.5 |
46.3 |
|
West Virginia |
40.0 |
49.6 |
64.9 |
|
Wisconsin |
26.3 |
44.9 |
50.9 |
|
Wyoming |
25.5 |
45.4 |
64.3 |
Related: Get Physical play systems and commercial playgrounds.
Learn about the author: Ben Thompson